Nonlinear methods are best applied when inelastic material behavior is considered in structural modeling and analysis. Nonlinear methods include static-pushover and dynamic time-history analyses. If only elastic material behavior is to be considered, linear methods should be suitable for design. Linear methods include strength-based and response-spectrum analyses. These methods, and the relations between their attributes, are presented in Figure 1:
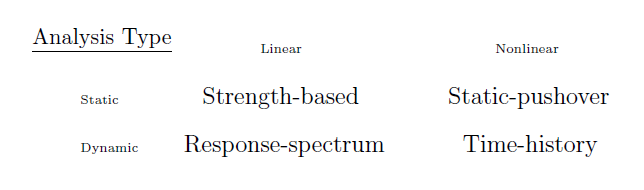
Figure 1 - Analysis methods
Each of these analysis methods has benefits and limitations. An overview of each method is as follows:
- Strength-based analysis is a static-linear procedure where structural components are selected such that their capacity exceeds the demand from loading. Strength-based demand-capacity (D-C) ratio indicate the adequacy of each component. If capacity does not meet demand, redesign is necessary. Modeling and analysis is fairly simple and straight-forward in that only component elastic-stiffness properties are considered. Strength-based analysis is also the least time-consuming method.
- Response-spectrum analysis is a dynamic-linear method where maximum structural response is plotted as a function of structural period and damping. Response may be the peak acceleration, velocity, or displacement which results from a given time-history record. Response-spectrum analysis is a linear application dependent upon the superposition of gravity and lateral effects. As a result, structures must remain essentially elastic during response-spectrum analysis. A series of time-history records may be analyzed and enveloped to form a smooth design spectrum.
- Static-pushover analysis is a static-nonlinear procedure which indicates the elastic and inelastic performance of a component or system subjected to monotonic loading which continually increases through an ultimate condition. This method produces a nonlinear force-deformation (F-D) relationship which provides insight into the ductility and limit-state behavior of a structure. Deformation parameters may be translational or rotational. Response is a function of both strength and deformation.
- Time-history analysis is a dynamic-nonlinear method which characterizes the dynamic response and inelastic behavior of a structure subjected to the time-history acceleration record of a ground motion (earthquake). The nonlinear material properties of ductile components, designed to yield under substantial loading, are modeled such that step-by-step integration may capture inelastic effect. Simultaneously, P-Delta effect take into account the influence of gravity loading on deformed structural configuration. Output may provide data, plots, and animations indicating structural response and component behavior.
Engineers may use any of these four analysis methods to suit the following purposes:
- To characterize and gain insight into structural behavior; and
- To generate information useful to the design decision-making process.
Sources of nonlinearity
There are two sources of nonlinearity which include the following:
- Geometric, which involves the effect of gravity load on displaced configuration, as discussed further in the Geometric nonlinearity article.
- Material, which is associated with the inelastic behavior of a structure, as discussed further in the Material nonlinearity article.
Capacity Design
Nonlinear modeling is fundamental to Capacity Design. Please visit the Capacity Design article to read more on this topic.
Related Content
Articles
Tutorials
Test Problems