Users should first run nonlinear analysis to generate the data necessary for plotting link hysteresis.
Once analysis is complete, users should define two plot functions, one for link deformation, and one for link force. These plot functions are generated as follows:
- Select Display > Show Plot Functions.
- On the Plot Function Trace Display Definition menu, select Define Plot Functions.
- Select Add Link Forces/Deformations > Add Plot Function.
- Specify a link label, along with the desired component and type of plot function.
- Select OK to save the definition.
- Select the defined plot function, then select Modify/Show Plot Function to assign such custom names as DEFORMATION for link deformation and FORCE for link force, as shown in Figure 1:


- Select deformation as the horizontal plot function and force as the vertical plot function, as shown in Figure 2:

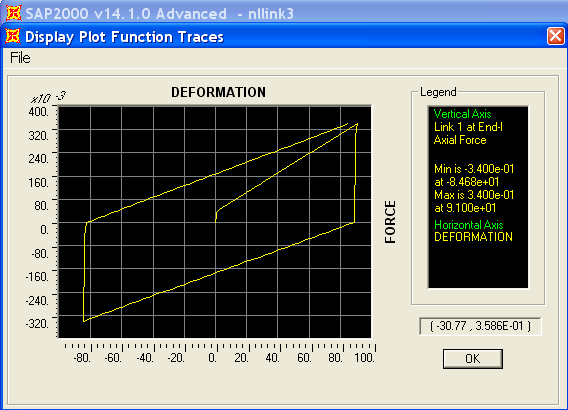
- Finally, select Display to display the hysteresis curve, as shown in Figure 3: